Examples
Examples are not intended to work out-of-the-box because they rely on data sources that might not be available or relevant for you. However they can be easily adapted to a working use case.
You can run a sample from the examples directory of the module like this:
cd examples
# If local installation
node .. ./dem2csv/jobfile.js
# If global/executable installation
krawler ./dem2csv/jobfile.js
cd examples
# If local installation
node .. ./dem2csv/jobfile.js
# If global/executable installation
krawler ./dem2csv/jobfile.jsIntermediate and product outputs will be generated in the ouput folder. The main available samples are detailed below.
ADS-B
Grab ADS-B data from two different providers using REST Web Services, convert it to a standardised JSON format, transform it to GeoJson and push it into AWS S3 and the local file system. To avoid "holes" the data from both providers are merged into a single file based on their unique identifier (a.k.a. ICAO). Once the file has been produced simply drag'n'drop them at geojson.io to see the live position of the Air Maroc fleet !
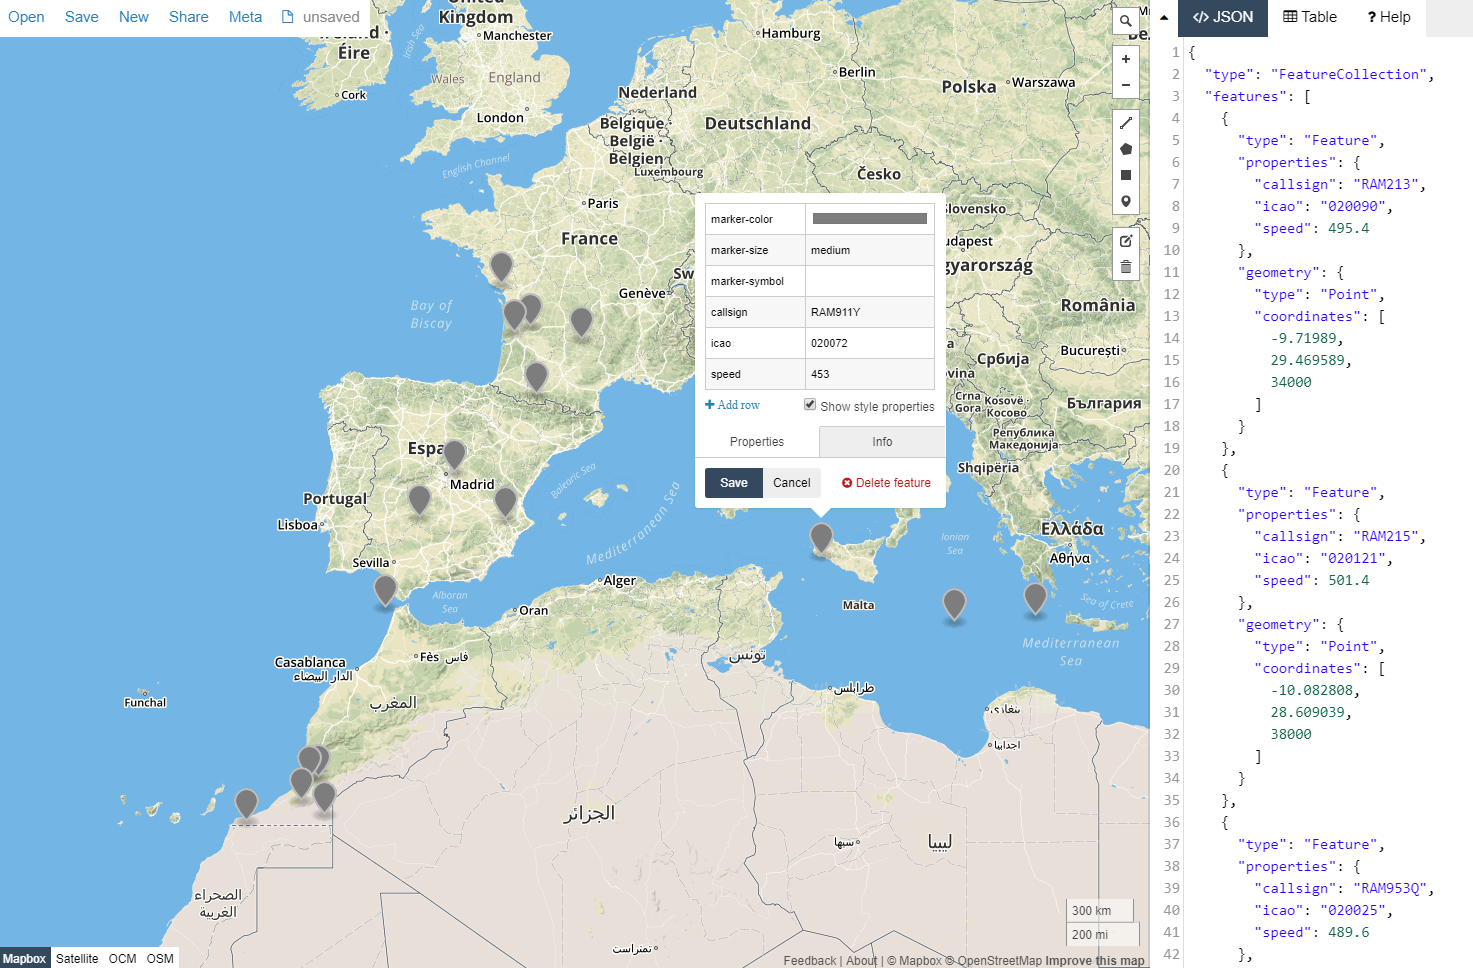
The hooks used are the following:

Most parameters can be directly edited in the jobfile. However, for security concerns, some secrets are not hard-written in the jobfile, as a consequence you must define the following environment variables to make this sample work:
- S3_ACCESS_KEY : AWS S3 Access Key ID
- S3_SECRET_ACCESS_KEY : AWS S3 Secret Access Key
- S3_BUCKET : the name of the S3 bucket to write the GeoJson file to
The web services used according to the providers are the following:
This sample demonstrates the flexibility of the krawler by using:
- different output stores and an intermediate in-memory store to avoid writing temporary files,
- a match filter to apply a given hook to a subset of the tasks (e.g. perform a JSON transformation adapted to the output of each provider)
- a JSON transformation to generate an unified format and filter data
- the same hook multiple times (e.g.
writeJson) with different options (e.g. to write to different output stores) - the same hook at the task or job level to manage unitary as well as merged data
Vigicrues
Grab data from the French flood warning system Vigicrues as GeoJson using REST Web Services, reproject it, style it according to alert level and push it into AWS S3 and the local file system. Once the file has been produced simply drag'n'drop it at geojson.io to see the live flood warnings !
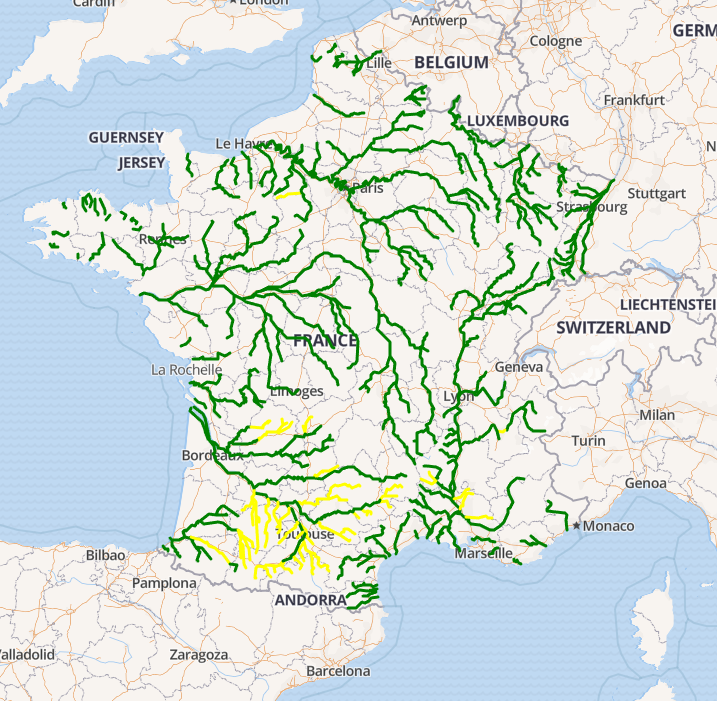
This sample is pretty similar to the ADS-B one plus:
- a reprojection to transform data from the Lambert 93 projection system to the WGS 84 projection system
- a JSON transformation with value mapping to generate styling information
csv2db
Grab a CSV file from AWS S3, convert it to GeoJson and push it into a PostGIS database table or MongoDB database collection (it will be dropped if it already exists). The hooks used are the following for PG (MongoDB is similar):

Some parameters like the input file name of the PostGIS host can be directly edited in the jobfile. However, for security concerns, some secrets are not hard-written in the jobfile, as a consequence you must define the following environment variables to make this sample work:
- S3_ACCESS_KEY : AWS S3 Access Key ID
- S3_SECRET_ACCESS_KEY : AWS S3 Secret Access Key
- S3_BUCKET : the name of the S3 bucket to read the CSV file from
- PG_USER : the name of the PostgreSQL user to be used to connect
- PG_PASSWORD : the password of the PostgreSQL user to be used to connect
dem2csv
Extract Digital Elevation Model DEM data from a WCS server and produces a CSV file. The output consists in a geographic grid of a given width (in meter) and resolution (in meter), centered around a location defined by [longitude, latitude] (in WGS84 degrees). Each row of the CSV contains the bounding box of a cell and the corresponding elevation value.
This sample is detailed in this article.
The original purpose was to ease ingestion of this data in a Hadoop system to perform some analysis
The sample folder contains a job configuration stored in jobfile.js to perform the process around a given location, which includes the hooks configuration in hooks-blocks.js.
The process can handle large datasets because the grid is split in a matrix of NxN blocks of blockResolution (in meter) to perform the data download and the merging of all block data relies on streams. The hooks used are the following:

Here is what look like the (intermediate) outputs generated: grid blocks in CSV and images

For illustration purpose we kept the original "naïve" implementation that performed data download of each grid cell independently. However, processing time was too long on high resolution grids, the hooks used were the following:

Docker
Provide web services with underlying pipeline functions managed using containers. This ensure you don't have to pollute your own operating system by installing anything except Docker and allow to make the processing scale on-demand, e.g. with an underlying swarm cluster.
Image conversion service
Convert an image file from PNG to JPG using ImageMagick running in a temporary dedicated container.
Before using this sample you will need to download the Image Magick image:
docker pull v4tech/imagemagick.
Launch the krawler as a web API with the job krawler jobfile-convert.js --api then POST the following request to http://localhost:3030/api/jobs:
{
	"tasks": [{ "id": "krawler-icon" }]
}
{
"tasks": [{ "id": "krawler-icon" }]
}You should see a krawler-icon.jpg file in the output folder once the job has been executed.
Map print service
Take a screenshot of a map using TestCafé running a Leaflet-based web mapping client in a temporary dedicated container and output the resulting image on S3.
This sample is detailed in this article.
Before using this sample you will need to build the required image from the sample directory:
docker build -t kalisio/leaflet-print ..
Launch the krawler as a web API with the job krawler jobfile-print.js --api then POST the following request containing the GeoJson data and print parameters to http://localhost:3030/api/jobs:
{
	"tasks": [{
		"format": "A4 Landscape",
		"baseLayer": "PlanetSat",
		"data": {
    		"type": "Feature",
			"geometry": {
				"type": "LineString",
				"coordinates": [[102.0,0.0],[103.0,1.0],[104.0,0.0],[105.0,1.0]]
			}
    	}
    }]
}
{
"tasks": [{
"format": "A4 Landscape",
"baseLayer": "PlanetSat",
"data": {
"type": "Feature",
"geometry": {
"type": "LineString",
"coordinates": [[102.0,0.0],[103.0,1.0],[104.0,0.0],[105.0,1.0]]
}
}
}]
}Once the job has been executed the response contains the link to download the printed image on S3 for each task:
[
    {
        "id": "bc185cb0-7983-11e8-883f-a333a7402f4a",
        ...
        "link": "https://s3.eu-central-1.amazonaws.com/krawler/bc185cb0-7983-11e8-883f-a333a7402f4a.png"
    }
]
[
{
"id": "bc185cb0-7983-11e8-883f-a333a7402f4a",
...
"link": "https://s3.eu-central-1.amazonaws.com/krawler/bc185cb0-7983-11e8-883f-a333a7402f4a.png"
}
]Seeder
The seeder take advantage of Kargo to seed a dataset. It relies on the seeding capabilities of MapProxy. The global approach is to subdivide the job into multiple tasks and run mapprroxy-seed utility for each task. To subdivide the job, we use a spatial grid and each cell is used as a coverage entry to limit the extend of the corresponding task. All the tasks, i.e. mapproxy-seed share the same MapProxy configuration file and use a generated seed file.
We use the same image of MapProxy as the one used in Kargo, but for now we do not use the benefits of a Swarm infrastructure to deploy the task. Meanwhile, if you plan to seed a layer with a source exposed by TileserverGL, you can easily scale the number of instances of TileserverGL to fit the required charge.
BD TOPO
Note: this example job has been entirely generated using AI (Claude) to check if it would be easily possible
Download vector features from the French national topographic database BD TOPO published by IGN on the Géoplateforme WFS service. The area of interest is defined by one or more EPCI SIREN codes and/or commune INSEE codes, resolved to actual commune geometries via the Admin Express layer of the same service. The resulting features are written as a single GeoJSON file in the output folder.
The job runs in two phases:
- Area resolution — Admin Express is queried to fetch the commune geometries matching the provided SIREN / INSEE codes. Their boundaries are unioned into a single polygon (adaptively simplified to keep the WFS filter URL within server limits) and used as a spatial
INTERSECTSfilter. - Paginated download — the total feature count is probed first; one WFS task per page is then generated so that all pages are downloaded in parallel before being merged into a single
FeatureCollection.
The target data type is configurable. Available types in the BDTOPO_V3 namespace:
| Type | Description |
|---|---|
batiment | Buildings |
erp | Public buildings (Établissements Recevant du Public) |
troncon_de_route | Road segments |
troncon_voie_ferree | Railway segments |
cours_d_eau | Waterways / Rivers |
plan_d_eau | Water bodies / Lakes |
zone_de_vegetation | Vegetation areas |
surface_hydrographique | Hydrographic surfaces |
aerodrome | Airports / Aerodromes |
The following environment variables control the job:
- BDTOPO_SIREN : comma-separated EPCI SIREN codes (e.g.
243100518,200096956). Defaults to200096956(Agen). - BDTOPO_INSEE : comma-separated commune INSEE codes (e.g.
31555,31069,47001). Can be used instead of or combined withBDTOPO_SIREN. - BDTOPO_DATA_TYPE : BD TOPO feature type to download (default:
erp). - BDTOPO_COUNT : number of features per WFS page (default:
1000).
This sample demonstrates:
- a two-step job where the first step (area resolution via Admin Express) drives task generation for the second step (BD TOPO download),
- dynamic task generation using a custom
generateTaskshook that computes the number of pages at runtime and generates one task per page, - adaptive geometry simplification using @turf/turf to union commune polygons and simplify the result to a URL-safe WKT length, with a convex hull fallback,
- paginated WFS download with
startIndex-based pagination and in-memory merge of allFeatureCollectionpages via a custommergeGeoJsonhook.