Customizing Kano
This section details different approaches to integrate your own data to your Kano instance. Although you can directly use the Kano UI to add your own data layers this section provide details to do this by configuration or programmatically. When added through the UI, the different layers will be visible in the My data tab of the catalog panel, while the default built-in layers will appear in the Catalog tab of the catalog panel. You can also manage the categories (i.e. catalog sections) hosting the layers from the UI or the configuration.
Although names and descriptions can be hard-coded in the target user language, Kano supports internationalization through a nested structure organized by locale like this:
{
	name: 'Categories.POPULATION_LAYERS',
  i18n: {
    fr: { Categories: { POPULATION_LAYERS: 'Population' } },
    en: { Categories: { POPULATION_LAYERS: 'Population' } },
    ...
  }
}
Note that the
nameproperty is used a unique identifier for categories and layers
Customizing the catalog
You can add your own categories in the catalog by defining it in additional files to be put in the kano/api/config/categories directory. Kano will glob all files within this directory and add categories accordingly, only matching by name those in the CATEGORIES_FILTER (comma-separated list of category names) environment variable, if any. Categories are simple objects with a name, a description and an icon from a standard icon set among Material Icons, Font Awesome, or Line Awesome.
my-categories.cjs - Used to define additional categories.
module.exports = [{
  name: 'Categories.OSM_LAYERS',
  i18n: {
    fr: {
      Categories: {
        OSM_LAYERS: 'OpenStreetMap'
      }
    },
    en: {
      Categories: {
        OSM_LAYERS: 'OpenStreetMap'
      }
    }
  },
  icon: 'las la-map',
  options: { exclusive: true, filter: { type: 'BaseLayer', tags: { $in: ['osm'] } } }
}, {
  name: 'Categories.POPULATION_LAYERS',
  i18n: {
    fr: {
      Categories: {
        POPULATION_LAYERS: 'Population'
      }
    },
    en: {
      Categories: {
        POPULATION_LAYERS: 'Population'
      }
    }
  },
  icon: 'las la-users',
  options: { exclusive: false, filter: { type: 'OverlayLayer', tags: { $in: ['population'] } } }
}]
Layers that will be added in a given category depends on the filter property content, which defines a sift filter applied to the layers list. Although any filter can be used, a tags property containing an array of relevent tags is often used by convention.
Customizing the catalog data
You can add your own layers in the catalog by defining it in additional files to be put in the kano/api/config/layers directory. Kano will glob all files within this directory and add layers accordingly, only matching by name those in the LAYERS_FILTER (comma-separated list of layer names) environment variable by default (set it to * to remove filtering). Layers are simple objects with a name, a description, a type, an attribution, and additional configuration options related to the underlying mapping engine: Leaflet for 2D rendering and Cesium for 3D rendering. More details about these options can be found in the documentation of the KDK powering Kano.
Please refer to the built-in
kano/api/config/layersdirectory for various examples of what is possible to do with Kano.
We will start with a really simple example by adding two different map backgrounds based on OpenStreetMap data to your Kano instance. First ensure you copied the categories and layers files in their respective directories in kano/api/config. Then, set CATEGORIES_FILTER="OSM_LAYERS POPULATION_LAYERS" and LAYERS_FILTER="OSM OSM_CYCLE" in your environment. Last, launch Kano to make the layers appear in your custom catalog.
osm-layers.cjs - Used to define base layers with OpenStreetMap data.
module.exports = [{
  name: 'Layers.OSM',
  description: 'Layers.OSM_DESCRIPTION',
  i18n: {
    fr: {
      Layers: {
        OSM: 'OpenStreeMap',
        OSM_DESCRIPTION: 'Données OpenStreetMap'
      }
    },
    en: {
      Layers: {
        OSM: 'OpenStreeMap',
        OSM_DESCRIPTION: 'OpenStreeMap data'
      }
    }
  },
  tags: ['osm'],
  attribution: 'OpenStreetMap © <a href="http://openstreetmap.org">OpenStreetMap</a> contributors',
  type: 'BaseLayer',
  leaflet: {
    type: 'tileLayer',
    isVisible: true,
    source: 'http://{s}.tile.osm.org/{z}/{x}/{y}.png',
    maxZoom: 21,
    maxNativeZoom: 18
  },
  cesium: {
    type: 'OpenStreetMap',
    isVisible: true,
    url: `http://a.tile.osm.org`
  }
}, {
  name: 'Layers.OSM_CYCLE',
  description: 'Layers.OSM_CYCLE_DESCRIPTION',
  i18n: {
    fr: {
      Layers: {
        OSM_CYCLE: 'OpenCycleMap',
        OSM_CYCLE_DESCRIPTION: 'Données OpenCycleMap'
      }
    },
    en: {
      Layers: {
        OSM_CYCLE: 'OpenCycleMap',
        OSM_CYCLE_DESCRIPTION: 'OpenCycleMap data'
      }
    }
  },
  attribution: 'OpenStreetMap © <a href="https://www.opencyclemap.org/">OpenCycleMap</a> contributors',
  type: 'BaseLayer',
  tags: ['osm'],
  leaflet: {
    type: 'tileLayer',
    isVisible: false,
    source: 'http://{s}.tile.thunderforest.com/cycle/{z}/{x}/{y}.png',
    maxZoom: 21,
    maxNativeZoom: 18
  },
  cesium: {
    type: 'OpenStreetMap',
    url: `http://a.tile.thunderforest.com/cycle`,
    isVisible: false
  }
}]
Except for raster data, vector data are always converted to GeoJson upfront or as a rendering preprocessing phase in Kano.
Using OGC standards
OGC Web Services (OWS) are the OGC standards that use the internet to view, edit, manage and share geospatial data. You can notably use the following standards in Kano:
- Web Map Services (WMS)
- Web Map Tile Service (WMTS)
- Tile Map Service (TMS)
- Web Feature Service (WFS)
- Web Coverage Service (WCS)
In this section we will use OGC web services of the French geographical institute (IGN). First copy the new layers file in the kano/api/config/layers directory. Then, add "POPULATION_DENSITY_WMTS POPULATION_DENSITY_WMS AIRPORTS_WFS" to your LAYERS_FILTER environment variable and launch Kano again to make the new layers appear in your custom catalog.
ogc-layers.cjs - Used to define additional layers using different protocols like WMTS, WMS and WFS.
module.exports = [{
  name: 'Layers.POPULATION_DENSITY_WMTS',
  description: 'Layers.POPULATION_DENSITY_WMTS_DESCRIPTION',
  i18n: {
    fr: {
      Layers: {
        POPULATION_DENSITY_WMTS: 'Densité (WMTS)',
        POPULATION_DENSITY_WMTS_DESCRIPTION: 'Densité de population (IGN)'
      }
    },
    en: {
      Layers: {
        POPULATION_DENSITY_WMTS: 'Density (WMTS)',
        POPULATION_DENSITY_WMTS_DESCRIPTION: 'Population density (IGN)'
      }
    }
  },
  type: 'OverlayLayer',
  attribution: '© <a href="https://ign.fr">IGN</a>',
  tags: ['population'],
  cesium: {
    type: 'WebMapTileService',
    url: 'https://data.geopf.fr/wmts?SERVICE=WMTS&REQUEST=GetTile&VERSION=1.0.0&LAYER=INSEE.FILOSOFI.POPULATION&STYLE=INSEE&FORMAT=image/png&TILEMATRIXSET=PM&TILEMATRIX={TileMatrix}&TILEROW={TileRow}&TILECOL={TileCol}',
    format: 'image/png',
    layer: 'INSEE.FILOSOFI.POPULATION',
    style: 'INSEE',
    tileMatrixSetID: 'PM',
    isVisible: false
  },
  leaflet: {
    type: 'tileLayer',
    source: 'https://data.geopf.fr/wmts?SERVICE=WMTS&REQUEST=GetTile&VERSION=1.0.0&LAYER=INSEE.FILOSOFI.POPULATION&STYLE=INSEE&FORMAT=image/png&TILEMATRIXSET=PM&TILEMATRIX={z}&TILEROW={y}&TILECOL={x}',
    bounds: [ [40, -5], [50, 10] ],
    opacity: 0.5,
    isVisible: false
  },
  legendUrl: 'https://data.geopf.fr/annexes/ressources/legendes/INSEE.FILOSOFI.POPULATION-tot-legend-2017.png'
}, {
  name: 'Layers.POPULATION_DENSITY_WMS',
  description: 'Layers.POPULATION_DENSITY_WMS_DESCRIPTION',
  i18n: {
    fr: {
      Layers: {
        POPULATION_DENSITY_WMS: 'Densité (WMS)',
        POPULATION_DENSITY_WMS_DESCRIPTION: 'Densité de population (IGN)'
      }
    },
    en: {
      Layers: {
        POPULATION_DENSITY_WMS: 'Density (WMS)',
        POPULATION_DENSITY_WMS_DESCRIPTION: 'Population density (IGN)'
      }
    }
  },
  type: 'OverlayLayer',
  attribution: '© <a href="https://ign.fr">IGN</a>',
  tags: ['population'],
  cesium: {
    type: 'WebMapService',
    url: 'https://data.geopf.fr/wms-r/wms',
    layers: 'INSEE.FILOSOFI.POPULATION',
    parameters: {
      version: '1.3.0',
      format: 'image/png',
      transparent: true,
      styles: 'INSEE'
    },
    isVisible: false
  },
  leaflet: {
    type: 'tileLayer.wms',
    source: 'https://data.geopf.fr/wms-r/wms',
    layers: 'INSEE.FILOSOFI.POPULATION',
    version: '1.3.0',
    format: 'image/png',
    transparent: true,
    bgcolor: 'FFFFFFFF',
    styles: 'INSEE',
    opacity: 0.5,
    isVisible: false
  },
  legendUrl: 'https://data.geopf.fr/annexes/ressources/legendes/INSEE.FILOSOFI.POPULATION-tot-legend-2017.png'
}, {
  name: 'Layers.AIRPORTS_WFS',
  description: 'Layers.AIRPORTS_WFS_DESCRIPTION',
  i18n: {
    fr: {
      Layers: {
        AIRPORTS_WFS: 'Aérodromes (WFS)',
        AIRPORTS_WFS_DESCRIPTION: 'Aérodromes (IGN)'
      }
    },
    en: {
      Layers: {
        AIRPORTS_WFS: 'Airports (WFS)',
        AIRPORTS_WFS_DESCRIPTION: 'Airports (IGN)'
      }
    }
  },
  type: 'OverlayLayer',
  icon: 'las la-plane',
  tags: ['administrative'],
  bbox: [
    -63.1537116941531,
    -21.3898266619462,
    55.8367758165235,
    51.3150480097903
  ],
  featureId: 'toponyme',
  wfs: {
    url: 'https://data.geopf.fr/wfs/ows',
    version: '2.0.0',
    searchParams: {},
    outputFormat: 'json',
    layer: 'BDCARTO_V5:aerodrome'
  },
  leaflet: {
    type: 'geoJson',
    realtime: true,
    tiled: true,
    minZoom: 10
  },
  cesium: {
    type: 'geoJson',
    realtime: true
  }
}]
You now should be able to see this after making some of the layers active:

Due to the possible large amount of vector data coming from the WFS the layer is configured with minZoom and tiled property so that data is only retrieved when zoom level exceed 10 for visible tiles only.
Using data files
Except by using the UI, there are two ways of adding data coming from a file based on configuration:
- serve and directly access the file over HTTP,
- ingest the file data into the database and access it using a built-in web service.
The second option is mandatory for large datasets or if you'd like to perform some filtering based on data feature properties. Accessing data stored in the database rely on the concept of FeathersJS service. As a consequence, the layer is usually associated with one (or more) source service where the data come from. Moreover, you should define a unique featureId on your features so that Kano can correctly separate and update data.
The data can be retrieved from a raw file with the
fileNamelayer property or a remote file with theurllayer property.
You should have a look to our detailed documentation for all possible styling options in 2D or 3D.
First copy the new layers file in the kano/api/config/layers directory. Then, add "REGIONS DEPARTMENTS" to your LAYERS_FILTER environment variable and launch Kano again to make some new layers appear in your custom catalog.
file-layers.cjs - Used to define additional layers using file data.
// Base URL to public files hosted in the docs
const baseUrl = (process.env.NODE_ENV === 'development' ? 'http://localhost:8082' : 'https://kalisio.github.io/kano')

module.exports = [{
  name: 'Layers.REGIONS',
  description: 'Layers.REGIONS_DESCRIPTION',
  i18n: {
    fr: {
      Layers: {
        REGIONS: 'Régions',
        REGIONS_DESCRIPTION: 'Régions Françaises'
      }
    },
    en: {
      Layers: {
        REGIONS: 'Regions',
        REGIONS_DESCRIPTION: 'French regions'
      }
    }
  },
  tags: ['administrative'],
  type: 'OverlayLayer',
  featureId: 'code',
  leaflet: {
    type: 'geoJson',
    source: `${baseUrl}/regions.geojson`,
    'stroke-color': 'blue',
    'fill-opacity': 0,
    popup: { pick: [] },
    tooltip: {
      template: '<b><%= properties.nom %></b>'
    }
  },
  cesium: {
    type: 'geoJson',
    source: `${baseUrl}/regions.geojson`,
    'stroke-color': 'blue',
    'fill-opacity': 0,
    popup: { pick: [] },
    tooltip: {
      template: '<%= properties.nom %>'
    }
  }
}, {
  name: 'Layers.DEPARTMENTS',
  description: 'Layers.DEPARTMENTS_DESCRIPTION',
  i18n: {
    fr: {
      Layers: {
        DEPARTMENTS: 'Départements',
        DEPARTMENTS_DESCRIPTION: 'Départements Français'
      }
    },
    en: {
      Layers: {
        DEPARTMENTS: 'Departments',
        DEPARTMENTS_DESCRIPTION: 'French departments'
      }
    }
  },
  tags: ['administrative'],
  type: 'OverlayLayer',
  featureId: 'code',
  service: 'airports',
  probe: 'Airports',
  url: `${baseUrl}/departments.geojson`,
  // Could also be a file path to a GeoJson or a gzipped GeoJson
  //fileName: path.join(__dirname, '../../../docs/.vitepress/public/departements.geojson'),
  leaflet: {
    type: 'geoJson',
    source: '/api/departments',
    'stroke-color': 'red',
    'fill-opacity': 0,
    popup: { pick: [] },
    tooltip: {
      template: '<b><%= properties.nom %></b>'
    }
  },
  cesium: {
    type: 'geoJson',
    source: '/api/departments',
    'stroke-color': 'red',
    'fill-opacity': 0,
    popup: { pick: [] },
    tooltip: {
      template: '<%= properties.nom %>'
    }
  }
}]
You now should be able to see a map highlighting some administrative boundaries in France:

If you have to ingest large datasets you should consider processing data using our ETL Krawler or ad-hoc processors. For instance, k-population ingest population data from a big GeoPackage into our database. You will find the associated layer definition in the built-in layers.
Time-varying data
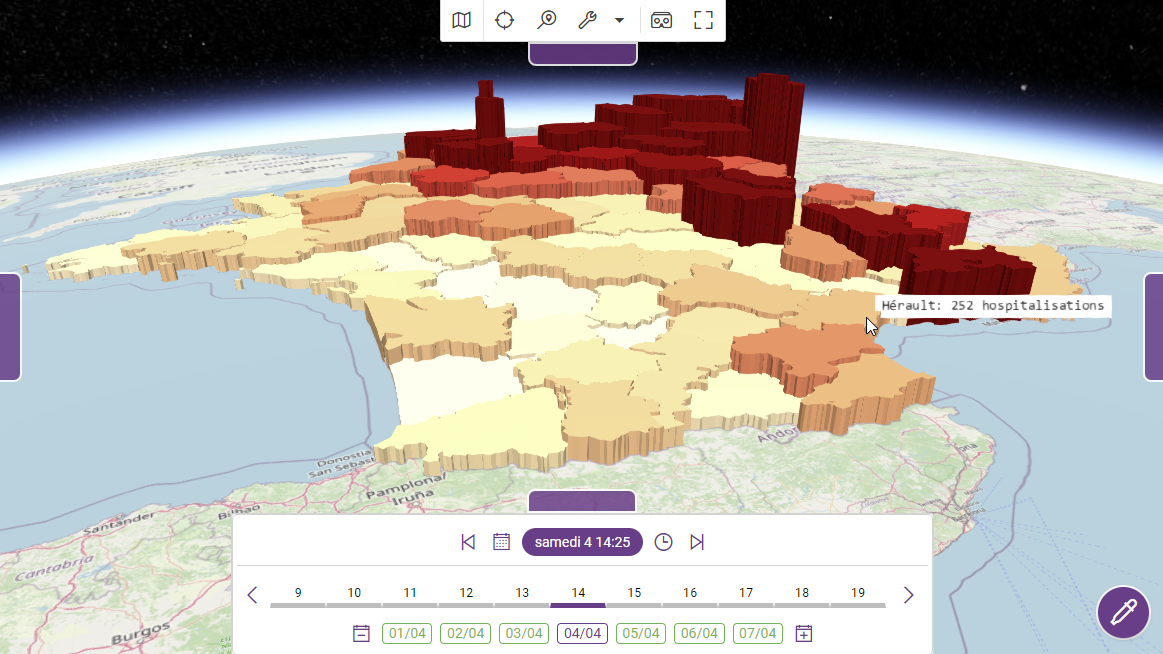
One of the best feature of Kano is interactive visualisation, meaning that data can be updated in real-time according to user actions or data updates. A typical use case is the visualisation of time-varying spatial datasets. In this section we will use some data providing the number of hospitalizations by department in France during the COVID-19 (from 20-03-2020 to 20-04-2020) to perform such a visualisation.
In this example there is one GeoJson file per day. First extract the data files to the public folder exposed by Kano. Then copy the new layers file in the kano/api/config/layers directory. Last, add "COVID_19" to your LAYERS_FILTER environment variable and launch Kano again to make the new layers appear in your custom catalog.
covid-19-layers.cjs - Used to define additional time-varying layers based on file data.
// Base URL to public files hosted in the docs
const baseUrl = (process.env.NODE_ENV === 'development' ? 'http://localhost:8082' : 'https://kalisio.github.io/kano')

module.exports = [{
  name: 'Layers.COVID_19',
  description: 'Layers.COVID_19_DESCRIPTION',
  i18n: {
    fr: {
      Layers: {
        COVID_19: 'COVID-19',
        COVID_19_DESCRIPTION: 'Hospitalisations par département'
      }
    },
    en: {
      Layers: {
        COVID_19: 'COVID-19',
        COVID_19_DESCRIPTION: 'Hospitalizations by department'
      }
    }
  },
  tags: ['health'],
  icon: 'fas fa-atlas',
  attribution: 'Santé Publique Fance / IGN / INSEE',
  type: 'OverlayLayer',
  featureId: 'code',
  every: 'P1D',
  leaflet: {
    type: 'geoJson',
    realtime: true,
    sourceTemplate: `${baseUrl}/covid-19/hospitalisations-departements-<%= time.format('YYYY-MM-DD') %>.json`,
    stroke: '#fee8c8',
    'stroke-width': 2,
    'stroke-opacity': 0.5,
    'fill-opacity': 0.5,
    'fill-color': '<%= chroma.scale(\'OrRd\').domain([0,50])(properties.taux).hex() %>',
    template: ['fill-color'],
    tooltip: {
      template: '<b><%= properties.nom %>: <%= properties.hospitalisations %> hospitalisations</b>',
      options: {
        opacity: 0.8,
        direction: 'top'
      }
    }
  },
  cesium: {
    type: 'geoJson',
    realtime: true,
    sourceTemplate: `${baseUrl}/covid-19/hospitalisations-departements-<%= time.format('YYYY-MM-DD') %>.json`,
    entityStyle: {
      polygon: {
        outline: false,
        extrudedHeight: '<%= 1000 * properties.taux %>',
        material: {
          type: 'Cesium.ColorMaterialProperty',
          options: {
            type: 'Cesium.Color.fromCssColorString',
            options: '<%= chroma.scale(\'OrRd\').domain([0,50])(properties.taux).css() %>'
          }
        }
      },
      template: ['polygon.extrudedHeight', 'polygon.material.options.options']
    },
    tooltip: {
      template: '<%= properties.nom %>: <%= properties.hospitalisations %> hospitalisations'
    }
  }
}]
Using the bottom timeline, navigate to some dates within the data time range, you now should be able to see a choropleth map highlighting the number of hospitalizations for each date:

You can even do the same using the 3D activity:
Using the API
The Kano API is particularly useful to update data continuously, a typical use case is data coming from network sensors performing measurements on the ground.
WARNING
You should use the local.cjs configuration file as stated in the installation section to setup a user account with appropriate rights (i.e. write acces to the API).
The different service endpoints of Kano can be accessed using REST as the most universal interface or using WebSockets if required (typically for complex queries or performance issue). The access to the endpoints are protected using a JWT (i.e. token), it must be defined using the Authorization header (Bearer token) in the request header for REST.
For instance using CURL you will send a request to the API like this (the body of the request being in the data.json file):
SET TOKEN="xxx"

curl -X POST -H "Authorization: Bearer %TOKEN%" ^
     -H "Content-Type: application/json" ^
     -d @data.json ^
     https://kano.dev.kalisio.xyz/api/service
Detailed information about the concepts and the data model behind our feature services can be found in the KDK documentation, although focused on how to retrieve the data.
To push a new station the body of the request will be a GeoJson feature like this:
{
  "properties": {
    "id": "174412d9e-f230-4127-af36-75654e265f56",
    "name": "Station 1"
  },
  "geometry": {
    "type": "Point",
    "coordinates": [
      1.5059948323127268
      43.547168883180966,
      0
    ]
  },
  "type": "Feature"
}
To push a new measure of the station the body of the request will be (a) GeoJson feature(s) like this:
// Single or multiple measures can be sent at once
[{
  "time": "2023-04-28T16:00:00",
  "properties": {
    "id": "174412d9e-f230-4127-af36-75654e265f56",
    "value": 24,
    "status": "OK"
  },
  "geometry": {
    "type": "Point",
    "coordinates": [
      1.5059948323127268
      43.547168883180966,
      0
    ]
  },
  "type": "Feature"
}, ...]
First copy the new layers file in the kano/api/config/layers directory. Then, add "SENSORS" to your LAYERS_FILTER environment variable and launch Kano again to make the new layers appear in your custom catalog.
sensors-layers.cjs - Used to define additional sensors layers based on API data feeding.
module.exports = [{
  name: 'Layers.SENSORS',
  description: 'Layers.SENSORS_DESCRIPTION',
  i18n: {
    fr: {
      Layers: {
        SENSORS: 'Capteurs',
        SENSORS_DESCRIPTION: 'Réseau de capteurs'
      },
      Variables: {
        TEMPERATURE: 'Température'
      }
    },
    en: {
      Layers: {
        SENSORS: 'Sensors',
        SENSORS_DESCRIPTION: 'Sensors network'
      },
      Variables: {
        TEMPERATURE: 'Temperature'
      }
    }
  },
  tags: ['sensors'],
  type: 'OverlayLayer',
  service: 'sensors-observations',
  probeService: 'sensors-stations',
  ttl: 7 * 24 * 60 * 60,
  featureId: 'id',
  featureLabel: 'name',
  from: 'P-7D',
  to: 'PT-1M',
  every: 'PT10M',
  queryFrom: 'PT-1H',
  variables: [
    {
      name: 'temperature',
      label: 'Variables.TEMPERATURE',
      unit: 'degC',
      range: [-50, 127],
      step: 5,
      chartjs: {
        backgroundColor: 'rgba(255, 99, 132, 128)',
        borderColor: 'rgb(255, 99, 132)',
        fill: false
      }
    }
  ],
  leaflet: {
    type: 'geoJson',
    realtime: true,
    tiled: true,
    cluster: { disableClusteringAtZoom: 18 },
    'marker-color': `<% if (properties.status === 'OK') { %>green<% }
                        else { %>red<% } %>`,
    'icon-classes': 'fa fa-wifi',
    'icon-x-offset': -2,
    'icon-color': '#FFF',
    template: ['marker-color'],
    tooltip: {
      template: '<%= properties.name %>: <%= properties.temperature %>°C'
    }
  },
  cesium: {
    type: 'geoJson',
    realtime: true,
    cluster: { pixelRange: 50 },
    'marker-symbol': 'lighthouse',
    'marker-color': '#180EF1',
    tooltip: {
      template: '<%= properties.name %>: <%= properties.temperature %>°C'
    }
  }
}]
Now, feed the API using the provided data in the public folder of the documentation:
curl -X POST -H "Authorization: Bearer %TOKEN%" -H "Content-Type: application/json" ^
     -d @stations-data.json https://your.kano.domain/api/sensors-stations
curl -X POST -H "Authorization: Bearer %TOKEN%" -H "Content-Type: application/json" ^
     -d @observations-data.json https://your.kano.domain/api/sensors-observations
TIP
For testing purpose you can get a valid token from the local storage in the developer tool after logged into Kano.
Using the bottom timeline, navigate to a date/time with existing sensor data, you now should be able to see your sensor on the map, selecting it should open the value timeseries:
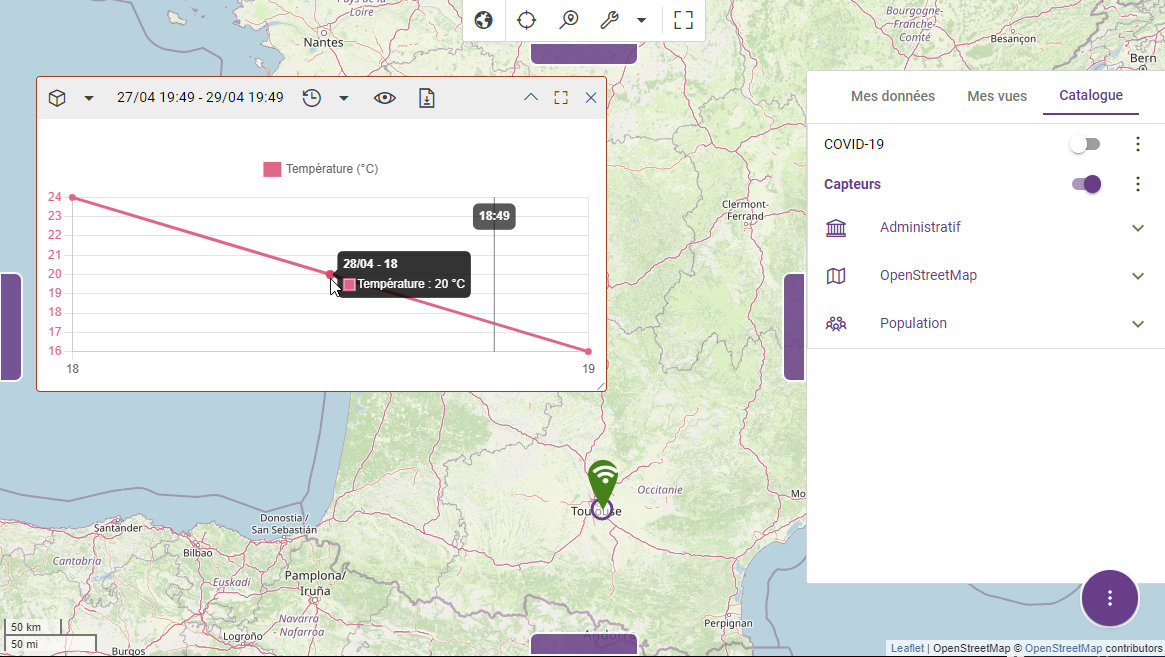
A data layer can contain multiple time-varying elements called variables. The features may contain additional properties, e.g. a status (OK/NOK), a name, etc. that can be used to customize the rendering, e.g. icon, color, tooltip, etc.
The main configuration options are the following:
- the property that will be use to uniquely identify a station (i.e. ID)
- the refresh rate of the data in the layer (used to automatically update the view every N seconds in Kano)
- the life time of a measure, i.e. if no measure found within the range
current time - life timethe station is not considered to have performed any measure for current time - the list of the variables contained in the data with associated properties to ease timeseries display (unit, range, color, ...)
TIP
A layer can have no fixed stations but only measurements from sensors in order to display moving data
Customizing the catalog legend
To be completed