Map Mixins
The underlying map object is based on Leaflet and some mixins also rely on Leaflet plugins. The following set of mixins is to be used to construct a new map activity and underlying Leaflet objects.
Base Map
DANGER
This mixin is a mandatory one to build a map activity
Make it possible to manage map layers and extend supported layer types:
- setupMap(domElement, options) creates the underlying Leaflet map object with given options
- addLayer(options)/removeLayer(name) registers/destroys a layer based on a catalog layer descriptor
- showLayer/hideLayer(name) (un)hides the given layer in map, on first show the layer will be lazily created
- hasLayer(name) check if a given layer is already registered
- isLayerVisible(name) check if a given layer is visible and underlying Leaflet object created
- zoomToLayer(name) fits the map view to visualize a given layer
- zoomToBounds(bounds) fits the map view to visualize a given extent as bounds [ [south, west], [north, east] ]
- toGeoJson(name) retrieve the content of a given layer as GeoJson features
- getLayerByName(name) retrieve the catalog layer descriptor for a given layer
- renameLayer(previousName, newName) rename a given layer
- removeLayer(name) destroys a given layer
- getLeafletLayerByName(name) retrieve the underlying Leaflet object for a given layer
- createLeafletLayer(options) creates the underlying Leaflet object based on a catalog layer descriptor, will check all registered constructor for any one matching
- getLeafletPaneByName(name) retrieve the underlying Leaflet object for a given pane
- createLeafletPane(name) creates the underlying Leaflet object for a pane
- removeLeafletPane(name) destroys the underlying Leaflet object for a given pane
- isPaneVisible(name) check if a given pane is visible
- showPane/hidePane(name) (un)hides the given pane in map
- registerLeafletConstructor(constructor) registers a Leaflet constructor function for a given type of layer
- center(longitude, latitude, zoomLevel, bearing, options) centers the map view to visualize a given point at a given zoom level, and possibly bearing when the leaflet-rotate plugin is active, some options like the following can also be added:
- an animation
durationin seconds to perform the changes, - an
offsetwithxandycoordinates in pixels for off-centered map
- an animation
- getCenter() get the current map view center as
longitude,latitudeandaltitude - getBounds() get the current map view bounds as
[ [south, west], [north, east] ] - setBearing(bearing, options) change the current bearing of the map when the leaflet-rotate plugin is active, options like the following can also be added:
- an
offsetwithxandycoordinates in pixels for off-centered map rotation
- an
- setCurrentTime(datetime) sets the current time to be used for time-based visualisation (e.g. weather forecast data or dynamic features)
You can perform smooth animation of map moves, including screen-space offset, with the center() method like this:
center(longitude, latitude, zoomLevel, bearing, {
  // Animate during 1 second
  duration: 1,
  // Cap target frame rate to avoid too much CPU consumption otherwise it will run as fast as possible
  fps: 30,
  animate: {
    // Animate along rhumb line with cubic bezier easing function
    center: { easing: { function: 'cubicBezier' }, rhumb: true },
    // No animation on zoom
    zoom: false,
    bearing: { easing: { function: 'cubicBezier' } }
  },
  // Move the center 300 pixels down on the screen
  offset: { x: 0, y: -300 }
})
Available easing functions are linear, easeOut (ease power as parameter), cubicBezier (coordinates of points defining the curve - x1, y1, x2, y2 - as parameters):
animate: {
  center: { easing: { function: 'linear' } },
  zoom: { easing: { function: 'easeOut', parameters: [0.5] } },
  bearing: { easing: { function: 'cubicBezier', parameters: [0.42, 0, 0.58, 1] } }
}
This mixin also adds the following internal data properties:
- layers available layers as catalog layer descriptors
This mixin automatically includes some Leaflet plugins like:
- leaflet-fa-markers to create markers using Font Awesome icons,
- Leaflet.fullscreen to manage fullscreen mode,
- Leaflet.markercluster to create marker clusters,
- Leaflet.donutcluster to create donut clusters,
- leaflet-graphicscale to add enhanced scale bar controls,
- leaflet.locatecontrol to display user's location,
- leaflet-geoman to edit layers,
- leaflet.geodesic to draw geodesic lines and circles,
- leaflet-timedimension to manage time dimension on some layers (typically WMS),
- leaflet-rotate to add rotation capabilities,
- Leaflet.VectorGrid to display vector tiles.
It also enhance the Leaflet Grid Layer class with an additional edgeBufferTiles property to control tiles pre-loading outside the current viewport like does this plugin.
Managing panes
Although DOM-based layers like Markers could make use of a z-index to possibly manage render order between them, SVG or canvas-based layers used to manage GeoJson features like Polylines provided no mean to do so. Similarly, there was no simple way to render some layers only at some specific zoom levels. This is the reason why Leaflet 1.0 introduced the concept of panes.
If you add a zIndex option to your layer descriptor we will create a dedicated pane for you under-the-hood so that the layer will be rendered at its right rank. Check the z-index value of the default panes to select the appropriate one.
If you add a panes option to your layer descriptor we will create the dedicated panes for you under-the-hood so that you can then set in the pane option of any sublayer the pane it will belong to. Each pane must have a unique name, an optional z-index and can be visible at specific zoom levels:
{
  name: 'Layer',
  ...
  panes: [{
    name: 'waypoints',
    zIndex: 450,
    minZoom: 7,
    maxZoom: 14
  }]
}
TIP
In the case you only specify a zIndex the name will be the zIndex (as string)
TIP
Features that are not attached to specific panes through the pane property in a layer will end up with the zIndex value of the layer (if none the default value is 400).
DANGER
Specifying zIndex or minZoom/maxZoom at layer level is mutually exclusive with defining panes at layer level.
Althought the visibility of the panes will be automatically updated based on the current zoom level of your map, you can also programmatically change it using the showPane/hidePane(name) methods.
Map Style
KDK introduces its own style specification as described below:
style: {
  visibility: true, // a boolean (or a string with "true" or "false" when templated) controlling feature's visibility, defaults to true
  // Line geometry
  line: {
    color: 'black' // any HTML color or [Quasar color](https://quasar.dev/style/color-palette/)
    width:  1 // any positive value
    opacity: 1.0 // range from 0.0 (transparent) to 1.0 (opaque)
    cap: 'round', // https://developer.mozilla.org/en-US/docs/Web/SVG/Attribute/stroke-linecap
    join: 'round', // https://developer.mozilla.org/en-US/docs/Web/SVG/Attribute/stroke-linejoin
    dashArray: 'none', // https://developer.mozilla.org/en-US/docs/Web/SVG/Attribute/stroke-dasharray
    dashOffset: 0 // https://developer.mozilla.org/en-US/docs/Web/SVG/Attribute/stroke-dashoffset
  },
  // Polygon geometry
  polygon: {
    color: 'black', // fill color, any HTML color or [Quasar color](https://quasar.dev/style/color-palette/)
    opacity: 1.0, // fill opacity
    fillRule: 'evenodd' // https://developer.mozilla.org/en-US/docs/Web/SVG/Attribute/fill-rule
    stroke: {
        color: 'black', // any HTML color or [Quasar color](https://quasar.dev/style/color-palette/)
        width: 1, // any positive value
        opacity: 1.0, // range from 0.0 (transparent) to 1.0 (opaque)
        cap: 'round', // https://developer.mozilla.org/en-US/docs/Web/SVG/Attribute/stroke-linecap
        join: 'round', // https://developer.mozilla.org/en-US/docs/Web/SVG/Attribute/stroke-linejoin
        dashArray: 'none', // https://developer.mozilla.org/en-US/docs/Web/SVG/Attribute/stroke-dasharray
        dashOffset: 0, // https://developer.mozilla.org/en-US/docs/Web/SVG/Attribute/stroke-dashoffset
    }
  },
  // Point geometry
  point: {
    shape: 'circle', // represent a registered SVG shape
    size: ['24px', '24px'], // array of HTML sizes
    radius: undefined,  // alternative to the size property.
    color: 'black', // any HTML color or [Quasar color](https://quasar.dev/style/color-palette/)
    opacity: 1.0, // range from 0.0 (transparent) to 1.0 (opaque)
    stroke: {
        color: 'black', // any HTML color or [Quasar color](https://quasar.dev/style/color-palette/)
        width: 1, // any positive value
        opacity: 1.0, // range from 0.0 (transparent) to 1.0 (opaque)
        cap: 'round', // https://developer.mozilla.org/en-US/docs/Web/SVG/Attribute/stroke-linecap
        join: 'round', // https://developer.mozilla.org/en-US/docs/Web/SVG/Attribute/stroke-linejoin
        dashArray: 'none', // https://developer.mozilla.org/en-US/docs/Web/SVG/Attribute/stroke-dasharray
        dashOffset: 0 // https://developer.mozilla.org/en-US/docs/Web/SVG/Attribute/stroke-dashoffset
    },
    icon: {
      classes: undefined // CSS class to use when icon comes from an icon font, e.g 'las la-home' (one of classes/url/symbol must be specified)
      url: '' // url to the image to be displayed. Alternative to the classes/symbol properties.
      symbol: '' // url to the svg sprite file + id of icon (eg. /assets/icons.svg#aircraft). Alternative to the classes/url properties.
      color: 'black', // any HTML color or [Quasar color](https://quasar.dev/style/color-palette/)
      opacity: 1.0, // range from 0.0 (transparent) to 1.0 (opaque)
      size: '14px', // any HTML size
      translation: ['-50%', '-50%'], // translation to apply to render the icon relative to the shape
      rotation: 0 // rotation to apply to render the icon relative to the shape
    },
    text: {
      label: undefined, // text to be displayed
      color: 'black', // any HTML color or [Quasar color](https://quasar.dev/style/color-palette/)
      size: '12px', // any HTML size
      translation: ['-50%', '-50%'], // translation to apply to render the text relative to the shape
      rotation: 0, // rotation to apply to render the text relative to the shape
      extraStyle: 'background-color: #1A1A1A' // additional CSS to be applied to text
    },
    html: null // an HTML element to be rendered
  }
}
KDK comes with a set of predefined marker shapes: circle, rect, rounded-rect, diamond, triangle, triangle-down, triangle-left, triangle-right, star, marker-pin, square-pin. But it allows you to register you own shape. See the Shapes section to understaned how to register a new shape.
When using the point.icon.symbol property, you must have an svg sprite file somewhere in which you define all your icons. An example of such a sprite file can be the following:
<?xml version="1.0" encoding="utf-8"?>
<svg xmlns="http://www.w3.org/2000/svg">
  <defs>
    <!-- icon1 -->
    <symbol id="icon1" viewBox="0 0 24 24">
      <path d="M19.88 ... "/>
      <path d="M1.8 ... "/>
    </symbol>
    <!-- icon2 -->
    <symbol id="icon2" viewBox="0 0 24 24">
      <path d="M88 ... "/>
    </symbol>
  </defs>
</svg>
And in the point.icon.symbol you can then reference your icons using /path/where/to/fetch/file.svg#icon1.
In addition and for backward compatibility, KDK supports an enhanced simple style spec options with the following mapping:
| SimpleStyleSpec | KDK Style |
|---|---|
z-index | pane |
| pane | pane |
| stroke | color |
stroke-color | color |
stroke-opacity | opacity |
stroke-width | weight |
| fill | fillColor |
fill-opacity | fillOpacity |
fill-color | fillColor |
| weight | weight |
| radius | radius |
line-cap | lineCap |
line-join | lineJoin |
dash-array | dashArray |
dash-offset | dashOffset |
marker-symbol | style.point.shape |
marker-size | style.point.size |
marker-color | style.point.color |
marker-anchor | style.point.anchor |
icon-url | style.point.icon.url |
icon-html | style.point.html |
icon-color | style.point.icon.color |
icon-size | style.point.icon.size |
icon-anchor | style.point.anchor |
icon-class | style.point.icon.classes |
icon-opacity | style.point.icon.opacity |
icon-classes | style.point.icon.classes |
icon-x-offset | style.point.icon.xOffset |
icon-y-offset | style.point.icon.yOffset |
The mixin automatically registers defaults styling for the the following type: point, line and polygon. For each type, the following options are merged with the following order of precedence:
- feature style: feature.style or simple style spec options located in feature.properties
- layer style set on layer descriptor
- engine style set on engine descriptor
TIP
All these style properties can be templated using lodash string templates. Their final values will be computed at creation/update time.
Example
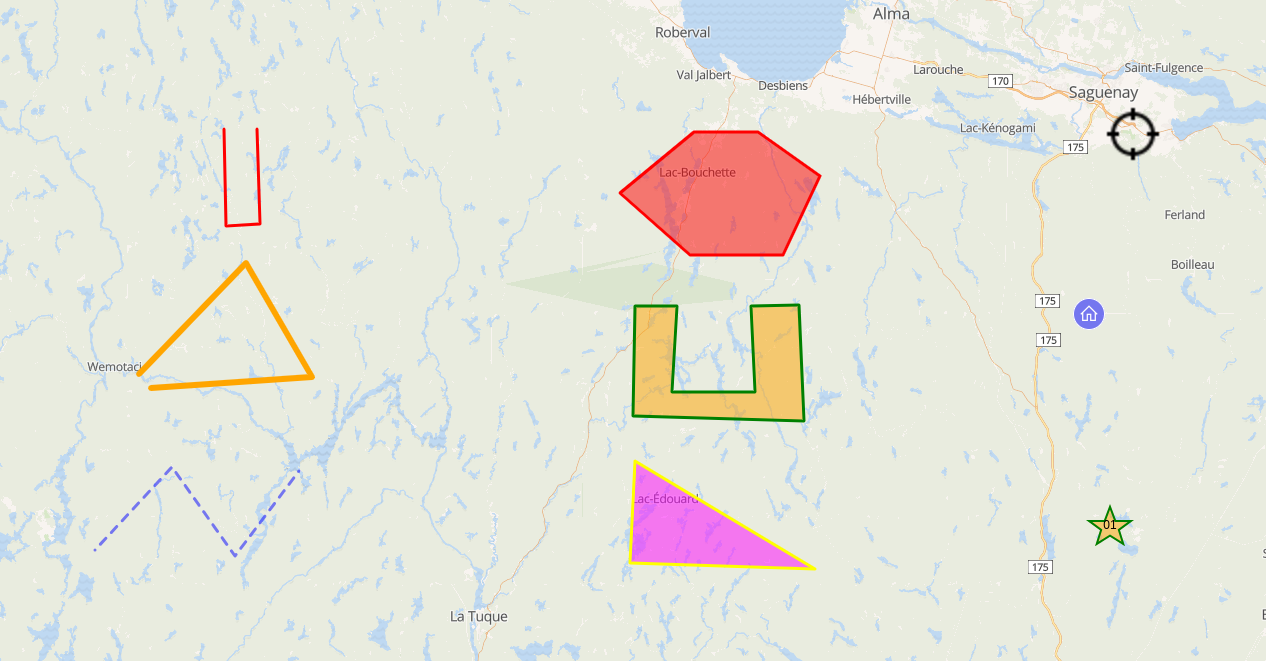
The following collection is rendered as illustrated below:
{
  "type": "FeatureCollection",
  "crs": { "type": "name", "properties": { "name": "urn:ogc:def:crs:OGC:1.3:CRS84" } },
  "features": [
    {
      "type": "Feature",
      "style": { "color": "magenta", "opacity": 0.5, "stroke": { "color": "yellow", "width": 3 } },
      "properties": { "name": "Parc de la Colline" },
      "geometry": { "type": "Polygon", "coordinates": [ [ [ -72.357206347890767, 47.72858763003908 ], [ -71.86027854004486, 47.527648291638172 ], [ -72.37075892446839, 47.539848426151735 ], [ -72.357206347890767, 47.72858763003908 ] ] ] }
    },
    {
      "type": "Feature",
      "properties": { "name": "Centre Paul-Étienne Simard", "fill": "orange", "stroke": "green", "stroke-width": 3 },
      "geometry": { "type": "Polygon", "coordinates": [ [ [ -72.357206347890767, 48.013440900213297 ], [ -72.239750684218109, 48.013440900213297 ], [ -72.253303260795718, 47.856056000888501 ], [ -72.027426984502114, 47.856056000888501 ], [ -72.036462035553868, 48.013440900213297 ], [ -71.905453795303586, 48.01646283861713 ], [ -71.891901218725963, 47.801464984333364 ], [ -72.361723873416651, 47.810567474765456 ], [ -72.357206347890767, 48.013440900213297 ] ] ] }
    },
    {
      "type": "Feature",
      "properties": { "name": "Loisirs Rivière du Moulin" },
      "geometry": { "type": "Polygon", "coordinates": [ [ [ -72.194575428959382, 48.33278115872843 ], [ -72.018391933450374, 48.33278115872843 ], [ -71.846725963467236, 48.251628525276693 ], [ -71.950629050562299, 48.107038644740094 ], [ -72.203610480011122, 48.107038644740094 ], [ -72.397864077623623, 48.221539261269051 ], [ -72.194575428959382, 48.33278115872843 ] ] ] }
    },
    {
      "type": "Feature",
      "style": { "color": "blue", "opacity": 0.5, "width": 3, "dashArray": "0 8 0" },
      "properties": { "name": "Saint-Remy-en-Bouzemont-Saint-Genest-et-Isson" },
      "geometry": { "type": "LineString", "coordinates": [ [ -73.839785615317746, 47.564240180362376 ], [ -73.627461915601779, 47.716431476953346 ], [ -73.455795945618627, 47.552045722357249 ], [ -73.279612450109633, 47.710352336655504 ] ] }
    },
    {
      "type": "Feature",
      "properties": { "name": "Sainte-Geneviève", "stroke": "orange", "stroke-width": 6 },
      "geometry": { "type": "LineString", "coordinates": [ [ -73.716981531178234, 47.889388912080449 ], [ -73.423342371996569, 48.091953743979651 ], [ -73.242641350961676, 47.883329977544491 ], [ -73.685358852497131, 47.862118125007399 ] ] }
    },
    {
      "type": "Feature",
      "properties": { "name": "Saint-Anicet" },
      "geometry": { "type": "LineString", "coordinates": [ [ -73.485142395986983, 48.338787334581873 ], [ -73.480624870461128, 48.161307640513321 ], [ -73.385756834417805, 48.164320903012829 ], [ -73.394791885469544, 48.338787334581873 ] ] }
    },
    {
      "type": "Feature",
      "style": { "shape": "star", "size": [48, 45], "color": "orange", "stroke": { "color": "green", "width": 2 }, "text": { "label": "01" } },
      "properties": { "name": "Sydenham" },
      "geometry": { "type": "Point", "coordinates": [ -71.051641470913779, 47.610352336655504 ] }
    },
    { "type": "Feature",
      "style": { "shape": "circle", "color": "blue", "size": [32, 32], "stroke": { "color": "white", "width": 1 }, "icon": { "classes": "las la-home", "color": "white", "size": "20" } },
      "properties": { "name": "Saint-Luc" },
      "geometry": { "type": "Point", "coordinates": [ -71.110369302750115, 47.998430466372736 ] }
    },
    {
      "type": "Feature",
      "style": { "shape": "none", "color": "transparent", "size": [64, 64], "icon": { "url": "icons/kdk/position-cursor.png" } },
      "properties": { "name": "Loisirs du Fjord du Saguenay" },
      "geometry": { "type": "Point", "coordinates": [ -70.988396113551573, 48.32977780546792 ] }
    }
  ]
}
Map Popup
Make it possible to generate Leaflet popups based on GeoJson feature properties. Use register/unregisterStyle(popup, generator) to (un)register a function f(feature, layer, options) returning a Leaflet popup
The mixin automatically registers a default generator that will create a popup displaying a property name/value table based on the following options with the following order of precedence
- popup: set on feature.properties or layer descriptor or in the popup property of component options
- pick: array of property names to appear in the popup
- omit: array of property names not to appear in the popup
- template: Lodash template to generate popup content with
feature, itspropertiesand translation function$tas context - text: text content of the popup, if provided will override default display
- options: Leaflet popup options
TIP
If you want to disable a default popup configuration like popup: { } (i.e. display all properties) on a per-layer basis you have to explicitely unset it on your layer options using popup: null or popup: false.
Map Tooltip
Make it possible to generate Leaflet tooltips based on GeoJson feature properties. Use register/unregisterStyle(tooltip, generator) to (un)register a function f(feature, layer, options) returning a Leaflet tooltip
The mixin automatically registers a default generator that will create a tooltip based on the following options with the following order of precedence
- tooltip: set on feature.properties or layer descriptor or in the tooltip property of component options
- property: property name to appear in the tooltip
- template: Lodash template to generate tooltip content with
feature, itspropertiesand translation function$tas context - text: text content of the tooltip, if provided will override default display
- options: Leaflet tooltip options
TIP
If you want to disable a default tooltip configuration like tooltip: { property: 'name' } (i.e. display all properties) on a per-layer basis you have to explicitely unset it on your layer options using tooltip: null or tooltip: false.
GeoJson Layer
Make it possible to manage and style raw or time-based GeoJson map layers (Leaflet.Realtime plugin is used under-the-hood):
- createLeafletGeoJsonLayer(options) automatically registered GeoJson Leaflet layer constructor
- updateLayer(name, geoJson, options) update underlying GeoJson data of a given layer, options like the following can also be added:
removeMissingwhentrueit will remove features from the layer that do not exist in the updated data, otherwise it will add new ones found and update matching ones based on thefeatureIdproperty of the layer definitionremovewhentrueit will remove given features from the layer based on thefeatureIdproperty of the layer definitionreplacewhentrueit will replace given features from the layer, otherwise it will update matching ones based on thefeatureIdproperty of the layer definition
You can perform smooth animation of map features using the following options with the updateLayer() method like this:
updateLayer('MyLayer', { type: 'FeaturesCollection', features: [...] }, {
  // Animate during 1 second
  duration: 1,
  // Cap target frame rate to avoid too much CPU consumption otherwise it will run as fast as possible
  fps: 30,
  animate: {
    // Animate along rhumb line with cubic bezier easing function
    geometry: { easing: { function: 'cubicBezier' }, rhumb: true },
    // Animation on the feature track property, which is actually a bearing angle
    track: { easing: { function: 'cubicBezier' }, bearing: true }
  }
})
Available easing functions are linear, easeOut (ease power as parameter), cubicBezier (coordinates of points defining the curve - x1, y1, x2, y2 - as parameters):
animate: {
  geometry: { easing: { function: 'linear' } },
  track: { easing: { function: 'easeOut', parameters: [0.5] }, bearing: true },
  value: { easing: { function: 'cubicBezier', parameters: [0.42, 0, 0.58, 1] } }
}
DANGER
The style mixin is mandatory when using this mixin. If you'd like to support popups/tooltips you should also use the popup mixin and/or tooltip mixin.
If your component has a onLeafletFeature(feature, layer, options) method it will be called each time a new GeoJson feature is created.
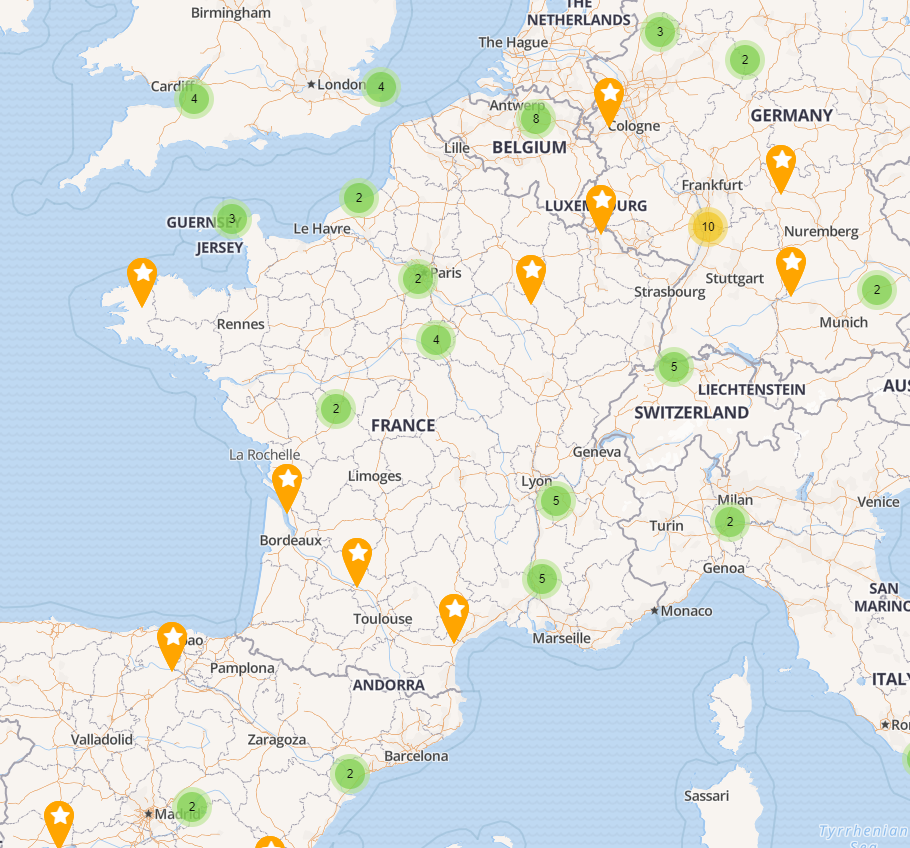
Clustering
Marker clustering options are to be provided in the cluster property of the Leaflet layer options or in the cluster property of component options, with this order of precedence. The following configuration illustrates a GeoJson marker cluster layer using options set on the layer descriptor (see image below):
{
  name: 'Layer',
  description: 'My sites',
  tags: [ 'business' ],
  icon: 'star',
  attribution: '(c) My company',
  type: 'OverlayLayer',
  leaflet: {
    type: 'geoJson',
    source: 'https://s3.eu-central-1.amazonaws.com/kargo/nuclear-sites.json',
    cluster: {},
    'marker-color': 'orange',
    'icon-color': 'white',
    'icon-classes': 'fa fa-star',
    popup: {
      pick: [ 'NAME' ]
    },
    tooltip: {
      property: 'LABEL'
    }
  }
}
TIP
If you want to disable a default clustering configuration like cluster: { disableClusteringAtZoom: 18 } on a per-layer basis you have to explicitely unset it on your layer options using cluster: null or cluster: false.
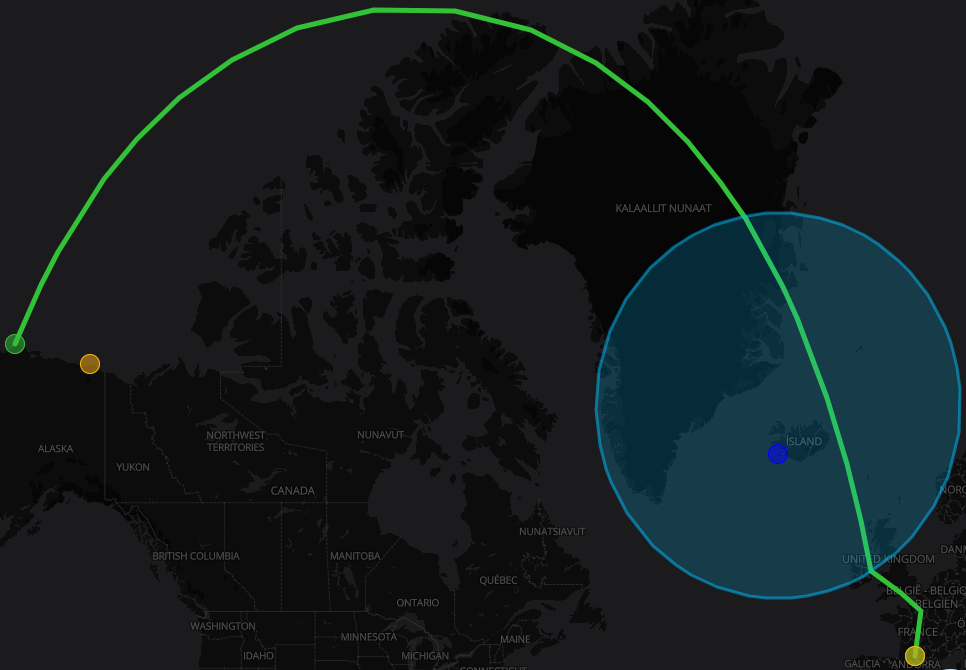
Additional feature types
The following options can be set as feature properties to manage more geometry types:
- geodesic boolean set to
trueon aLineStringwill result in a geodesic line from the Leaflet.Geodesic plugin - geodesic boolean set to
trueon aPointwill result in a great circle from the Leaflet.Geodesic plugin, which radius must be specified in meters - wrap additional Leaflet.Geodesic plugin option, when geodesic is specified, defaults to
false - steps additional Leaflet.Geodesic plugin option, when geodesic is specified, defaults to
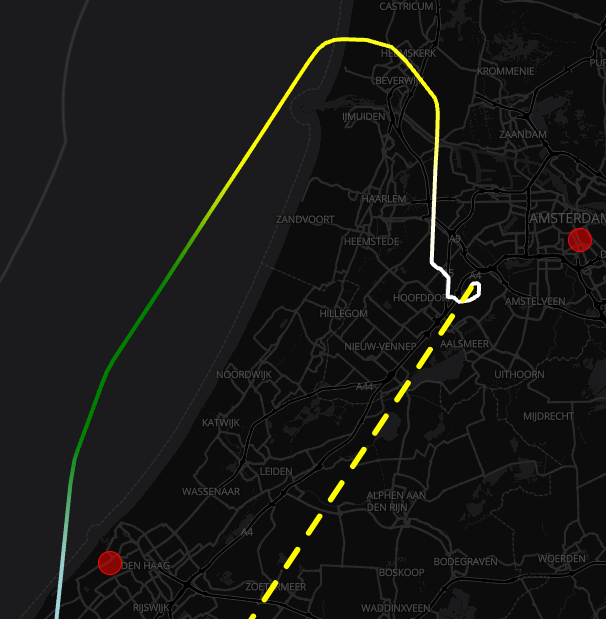
4or360for circles - gradient color array set on a
LineStringwill result in a color ramp applied to the line by mapping each point to the corresponding color in the array - svg for gradient set it to
trueto use SVG rendering otherwise WebGL will be used - mask boolean set to
trueon aPolygonorMultiPolygonwill result in the polygon(s) acting as a mask over the map - offset integer set to a number of pixels on a
LineStringwill result in the line being offset by the specified number of pixels when drawn
Dynamic styling
Usually the same style is used for all features of a GeoJson layer, you might however require a more dynamic style base on each feature properties. To handle this use case you can either:
- provide styling options for each feature in their
propertiesorstylefield - use Lodash templating on layer styling options with feature and its properties as context
WARNING
Templating can only be efficient if compilers are created upfront, as a consequence you need to declare the list of templated options in your layer styling using the template property.
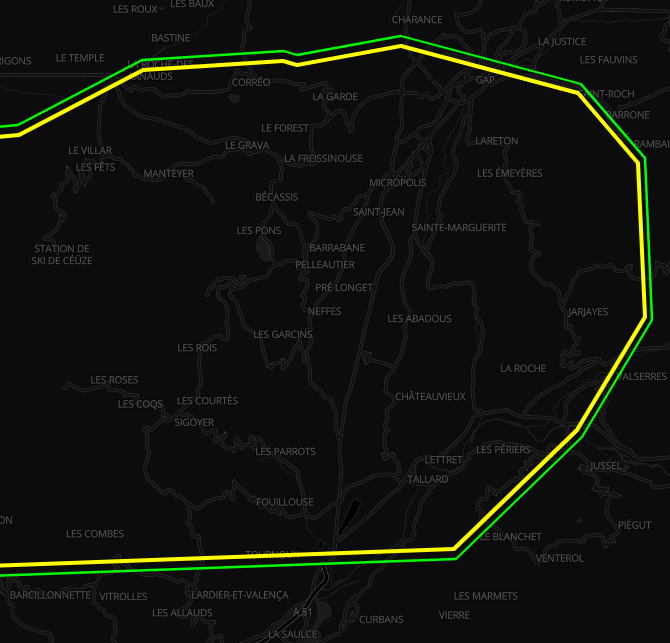
For instance you can change the marker color or image based on a given features's property like this:
'marker-color': `<% if (properties.visibility < 75) { %>#000000<% }
                  else if (properties.visibility < 300) { %>#d20200<% }
                  else if (properties.visibility < 1500) { %>#f9b40f<% }
                  else if (properties.visibility < 3000) { %>#eef52f<% }
                  else { %>#33c137<% } %>`,
'marker-symbol': `<% if (properties.visibility < 75) { %>/statics/windyblack.png<% }
                    else if (properties.visibility < 300) { %>/statics/windyred.png<% }
                    else if (properties.visibility < 1500) { %>/statics/windyorange.png<% }
                    else if (properties.visibility < 3000) { %>/statics/windyyellow.png<% }
                    else { %>/statics/windygreen.png<% } %>`,
template: ['marker-color', 'marker-symbol']
You can also draw a path with a different styling on each part like this:
{
  type: 'FeatureCollection',
  features: [{
    type: 'Feature',
    properties: { stroke: '#000000', weight: 1 },
    geometry: { type: 'LineString', coordinates: [...] }
  }, {
    type: 'Feature',
    properties: { stroke: '#FF00FF', weight: 3 },
    geometry: { type: 'LineString', coordinates: [...] }
  }]
}
Dynamic building
You might want to dynamically build new GeoJSON features based on existing ones, such as creating a gradient color line from a set of points depending on a specific property value. To handle this use case, you can define build options in the layer's variables section.
WARNING
Only one build option can be defined per layer.
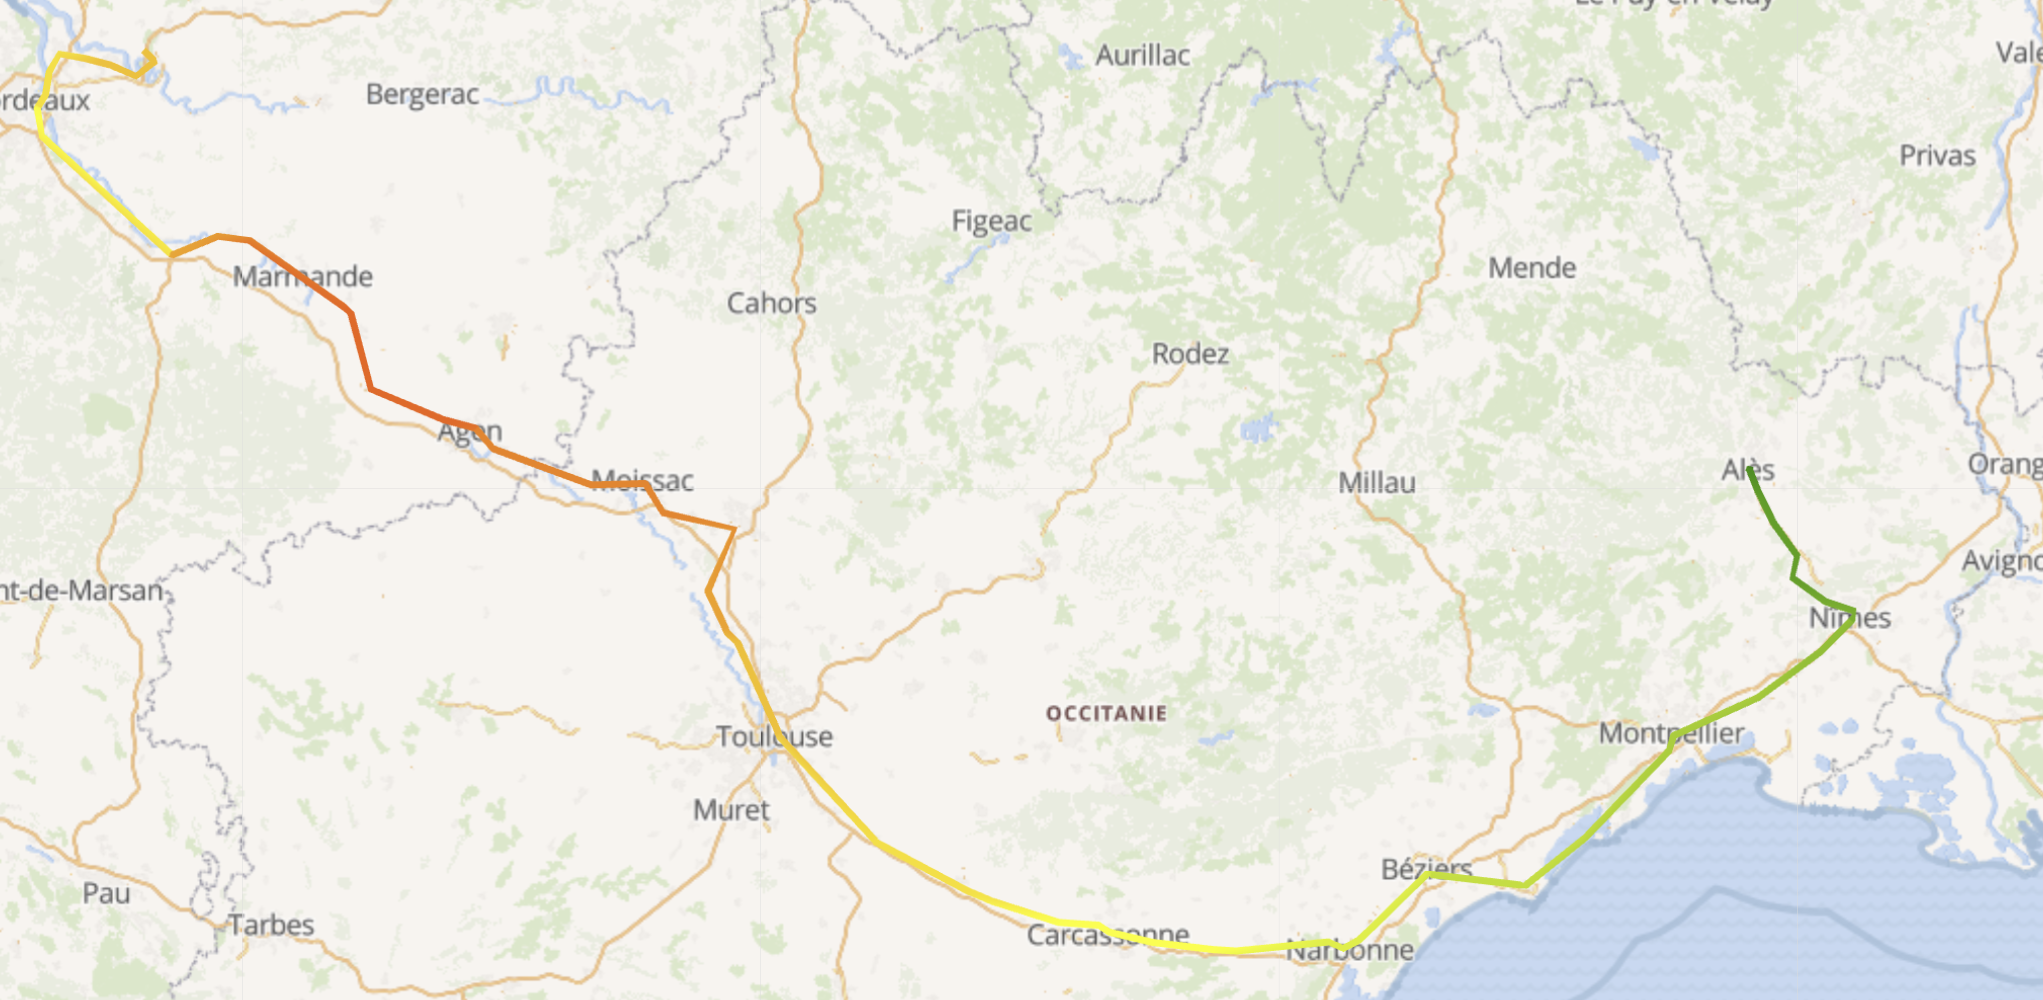
Dynamically building a gradient path
A gradient path is a line string where each point has a color and the rendering of that line interpolates colors along each line segment. Generally a color map is used to map between arbitrary feature properties and a color.
You can dynamically build gradient paths adding a gradientPath object to the variable you want to use as source for the color map. The color map used to compute the color of each point is the one defined in the variable object. The line will be built by linking all the GeoJSON points sorted by time. The layer's featureId property is used to perform the aggregation and group related points.
The following example will group features by sensorId, produce a line string for each unique sensorId and for each of those lines, will use the accuracy property of each point to compute the color along the lines.
featureId: 'sensorId',
variables: [
  {
    name: 'accuracy',
    chromajs: {
      colors: ['#00FF00', '#FFFF00', '#FFAA00', '#FF0000'],

      classes: [0, 500, 1000, Number.MAX_VALUE] // For predefined colors
      // or
      domain: [0, 1500],                        // For continuous color gradient
    },
    gradientPath: {
      properties: {
        weight: 7,
        opacity: 0.65,
      }
    }
  }
]
The required fields are:
chromajs: this is what will be used to compute the mapping betweenaccuracyvalues and color for each pointgradientPath: this is what triggers the construction of the gradient path line, the following properties have a special meaning:svg: a boolean, if true the rendering will be done using an SVG element, otherwise it'll use WebGL and pixi.jsopacity: a floating point value[0,1]to blend the gradient path with the mapweight: ifsvgis set, this is a pixel value (independent of zoom level) to use to draw the line. If not set that's a way to specify the width of the line.
Every property in the gradientPath.properties section will be added to the produced GeoJSON line string.
PMTiles Layer
Make it possible to display and style PMTiles datasets in the map as other layers. The display of the PMTiles data in the map is handled using the protomaps-leaflet plugin.
- createLeafletPMTilesLayer(options) automatically registered PMTiles Leaflet layer constructor
PMTiles layers support:
- current
timeupdate, provided the style used to display data takes time value into account - current
levelupdate, provided the style used to display data takes level value into account - layer filters based on MongoDB query langage
- KDK styles applied to layer filters
- KDK style, MapBox style (partially) and protomaps style, although it's not possible to mix different style types.
The code determine which style to use based on the following algorithm:
- if the
stylemember is a string, then it assumes this is a json file to fetch defining a Mapbox style. - if the
stylemember is an object and contains at least onesymbolizersubobject, then is assumes this is a protomaps style definition - finally if the
stylemember is not empty, then it assumes it's a KDK style definition
Here's a minimal example of a PMTiles layer definition, using a KDK style :
{
    name: 'PMTiles layer',
    type: 'OverlayLayer',
    leaflet: {
        type: 'pmtiles',                           // required
        url: 'https://url.to/public/file.pmtiles', // required, points to PMTiles dataset
        dataLayer: 'pmtile_layer',                 // required, defines in which PMTiles layer we'll fetch features
                                                   // since that's not something we can define in the KDK style object
        style: {
            polygon: {
                color: `<% if      (properties.type === 'car') { %>rgba(255, 0, 0, 1)<% }
                           else if (properties.type === 'bus') { %>rgba(255, 255, 0, 1)<% }
                           else                                { %>rgba(255, 0, 255, 1)<% }`
            }
        }
    }
}
INFO
When using lodash template strings in style values, the evaluation context gets an object with the following members (among others):
{
    feature: { ... },    // the currently drawn feature
    properties: { ... }, // the currently drawn feature's properties
}
This allows to implement dynamic styling (supported in KDK and protomaps styles). To know the full evaluation context, you should refer to the source code of the mixin.
Here's the same example using a protomaps style definition :
{
    name: 'PMTiles layer',
    type: 'OverlayLayer',
    leaflet: {
        type: 'pmtiles',                           // required
        url: 'https://url.to/public/file.pmtiles', // required, points to PMTiles dataset
        style: {
            polygon: {                             // arbitrary key name, doesn't impacte style, it just defines a protomaps style rule
                dataLayer: 'pmtile_layer',         // using protomaps styles, the dataLayer can be specified in the style object
                symbolizer: {                      // protomaps symbolizer definition
                    type: 'PolygonSymbolizer',
                    color: `<% if      (properties.type === 'car') { %>rgba(255, 0, 0, 1)<% }
                               else if (properties.type === 'bus') { %>rgba(255, 255, 0, 1)<% }
                               else                                { %>rgba(255, 0, 255, 1)<% }`,
                    // other symbolizer properties, cf protomaps-leaflet symbolizer constrctors ...
                }
            }
        }
    }
}
Edit Layer
Make it possible to edit features of a GeoJson layer (geometry and properties):
- editLayer(name) start/stop layer edition on a given layer
- updateFeatureProperties(feature, layer, leafletLayer) update feature properties action handler that will open an editor to define feature properties
WARNING
It has to be used with the GeoJson layer mixin and will use the configured styling.
File Layer
Make it possible to drag'n'drop GeoJson or KML file on the map (Leaflet.FileLayer plugin is used under-the-hood). It will automatically create a new GeoJson layer named after the filename on drop. As a consequence it has to be used with the GeoJson layer mixin and will use the configured styling.
Forecast Layer
Make it possible to manage Weacast map layers:
- createLeafletForecastLayer(options) automatically registered Weacast Leaflet layer constructor
WARNING
This mixin assumes that your component has initialized its Weacast client in the weacastApi property by using e.g. the Weacast mixin
Canvas Layer
Make it possible to draw custom graphic elements on top of other layers using HTML canvas elements. These custom graphic elements are defined by their draw function and are run in the client application, using a controlled draw context. It is not possible for these draw functions to access anything outside the specified context.
createLeafletCanvasLayer (options) is automatically registered to allow creation of such Leaflet layer. The following fields can be set on the options object:
- draw an array containing the same information as given to setCanvasLayerDrawCode drawCode parameter.
- userData an object containing user data that'll be usable in the draw code.
- autoRedraw boolean set to true if the canvas should automatically be redrawn every frame.
- pointerEventsEnabled boolean set to true to enable pointer events on the canvas layer (required if you use clickable elements).
- clickThroughEnabled boolean set to true to allow click events to go through the canvas layer when no clickable elements were clicked (requires pointerEventsEnabled to work).
setCanvasLayerDrawCode (layerName, drawCode, autoRedraw) define the draw code used by the layer named
layerName.autoRedrawis a boolean used to enable automatic refresh of the layer at each displayed frame (required eg. to animate elements).drawCodeis expected to be an array of objects where each object is of the following form :{ feature: 'LAYER_NAME?FEATURE_NAME', code: '... some javascript draw code ...' }will run the given draw code only for the feature namedFEATURE_NAMEin the layer namedLAYER_NAME.{ layer: 'LAYER_NAME', code: '... some javascript draw code ...' }will run the given draw code for each feature of the layer namedLAYER_NAME.
setCanvasLayerUserData (layerName, userData) is used to add some custom user data to the draw context. The
userDataobject parameter will be merged into theuserDataobject available on the draw context. This allows users to push partial updates, there's no need to push the whole user data every time a single member changes.setCanvasLayerAutoRedraw (layerName, autoRedraw) is used to enable or disable automatic redraw of the canvas layer named
layerName. Automatic redraw may be required for example when animating objects. By default automatic redraw is off, which means that the canvas layer will only redraw when :- the user moves the map
setCanvasLayerDrawCodeis calledsetCanvasLayerUserDatais called
The following configuration illustrates a layer used to draw feature property name as text at the feature position for all features of the layer named Airports.
{
  name: 'AirportNames',
  type: 'OverlayLayer',
  icon: 'local_airport',
  leaflet: {
    type: 'kanvasLayer',
    isVisible: true,
    draw: [
      layer: 'Airports', code: `
        const props = ctx.feature.properties
        const coords = {
          lat: ctx.feature.geometry.coordinates[1],
          lon: ctx.feature.geometry.coordinates[0]
        }

        const pos = ctx.latLonToCanvas(coords)
        ctx.canvas.font = '10px sans-serif'
        ctx.canvas.fillStyle = '#ffb300'
        ctx.canvas.fillText(ctx.feature.properties.name, pos.x, pos.y)
      `
    ]
  }
}
The ctx object is the draw context and is the only object available from the draw code.
By default, the following fields are available on the draw context :
- canvas the canvas rendering interface by which the drawing will occur. Draw api is available here.
- now the time of the draw function call, can be useful to animate things.
- zoom the current map zoom value.
- latLonToCanvas (coords) project from latitude/longitude to canvas coordinates (pixels).
- addClickableFeature (geojson, path, clickStyle) add a clickable path element associated with the
geojsonfeature. When clicked, it will emit a 'clicked' event with the associated feature as event data. - clearClickableFeatures () clear all the clickable features that have been added so far.
- userData object where all the user data pushed through
setCanvasLayerUserDatahas been merged. - vec2 (a, b) build a vec2 object from two points (where points and vec2 are objects with
xandymembers ). - len2 (vec) compute length of a vec2 vector.
- scale2 (vec, value) scale a vec2 vector by
value. - norm2 (vec) return the corresponding normalized vec2 vector.
TIP
It is possible to extend what's available in the draw context from the application using the CanvasDrawContext singleton. In this case you should call CanvasDrawContext.merge(contextAdditionObject) to merge the content of contextAdditionObject with the draw context. This call must be done before the canvas layer mixin is created. This can be useful to build an application specific library of draw functions and make these available to the canvas layer instances.
Map Activity
Make it easier to create 2D mapping activities:
- initializeMap() setup the mapping engine, should be called first before any other method
- finalizeMap() destroy the mapping engine
DANGER
It assumes that the DOM element used by the render engine has a ref named map